Predictive Visualization
Our platform is highly intuitive and interactive, helping you answer critical questions that impact your mail while showing trends and outliers that you might miss in traditional reports.
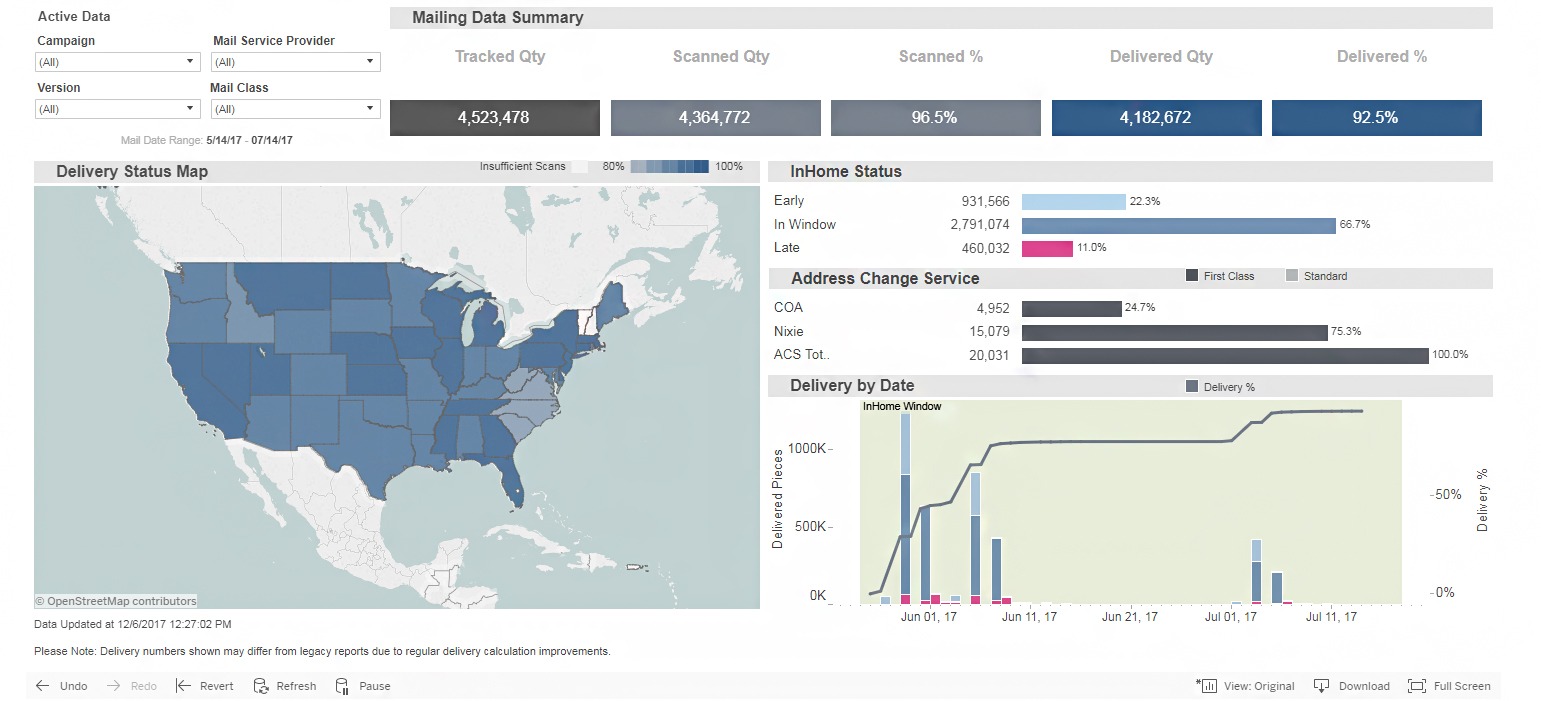
Data Visualization
Allow for fast decision making based on visual cues and a graphic presentation of your data. Quickly spot patterns and trends with just a glance.
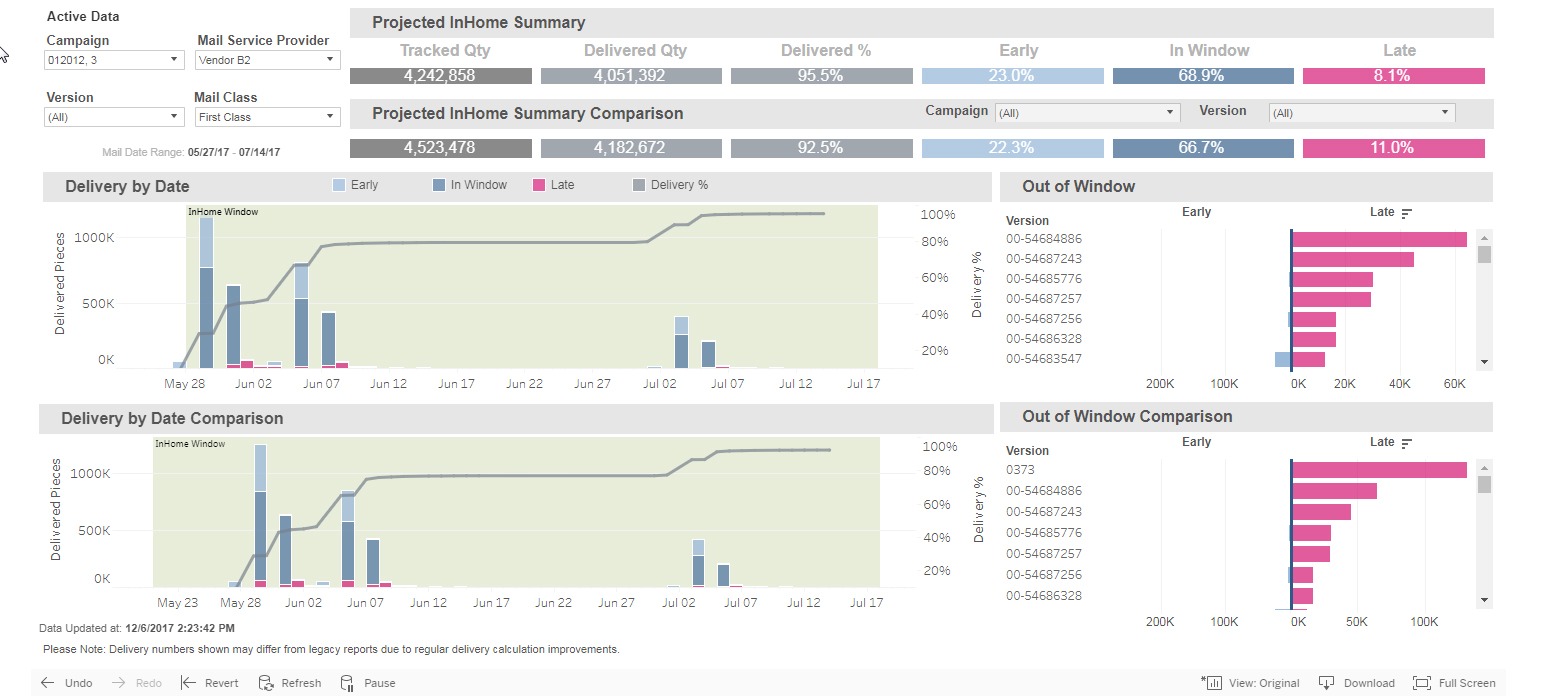
Campaign Visibility
Get fast and powerful insight into your data. Make informed choices even without knowing the specific details.
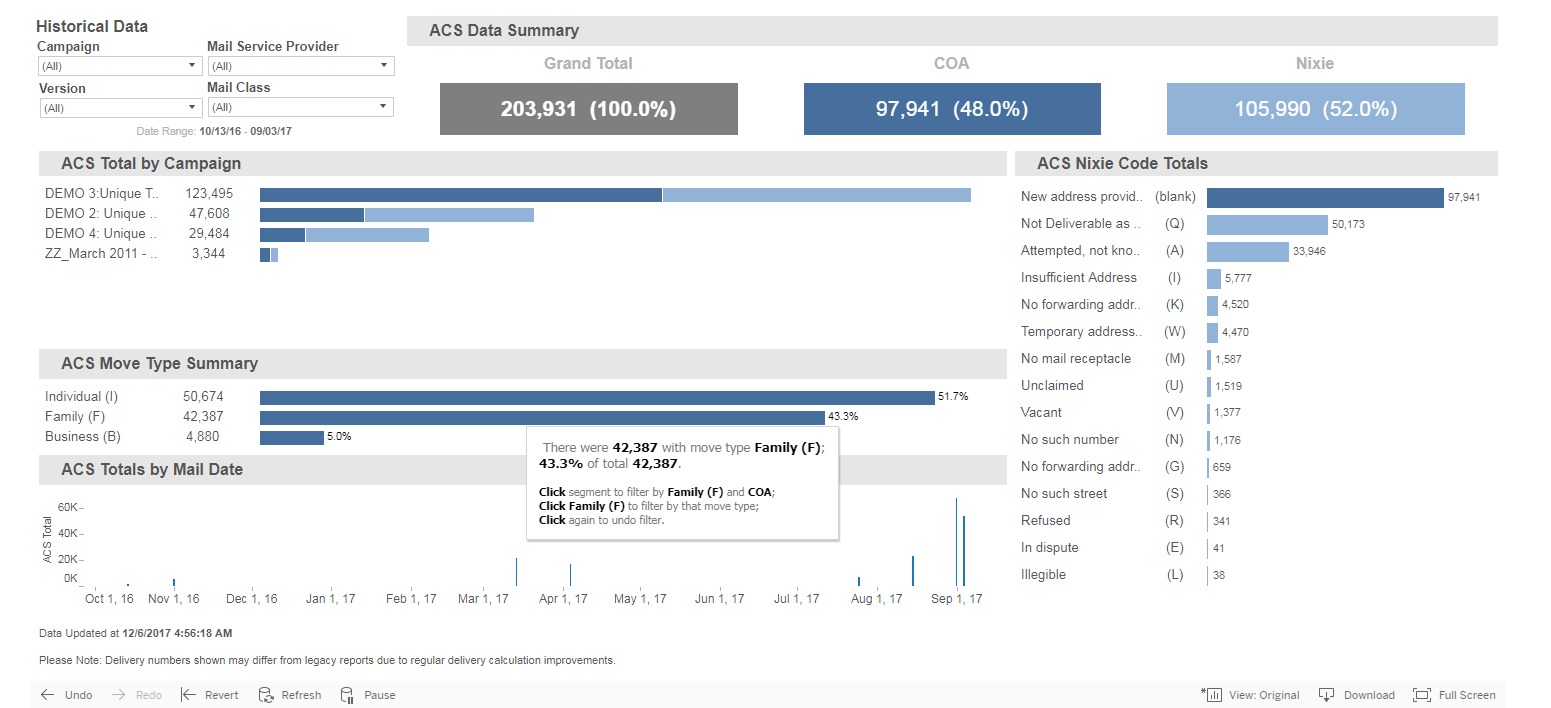
Interactive Postal Data
Explore postal data without having to run multiple reports. Questions about your data are answered with just a few clicks.
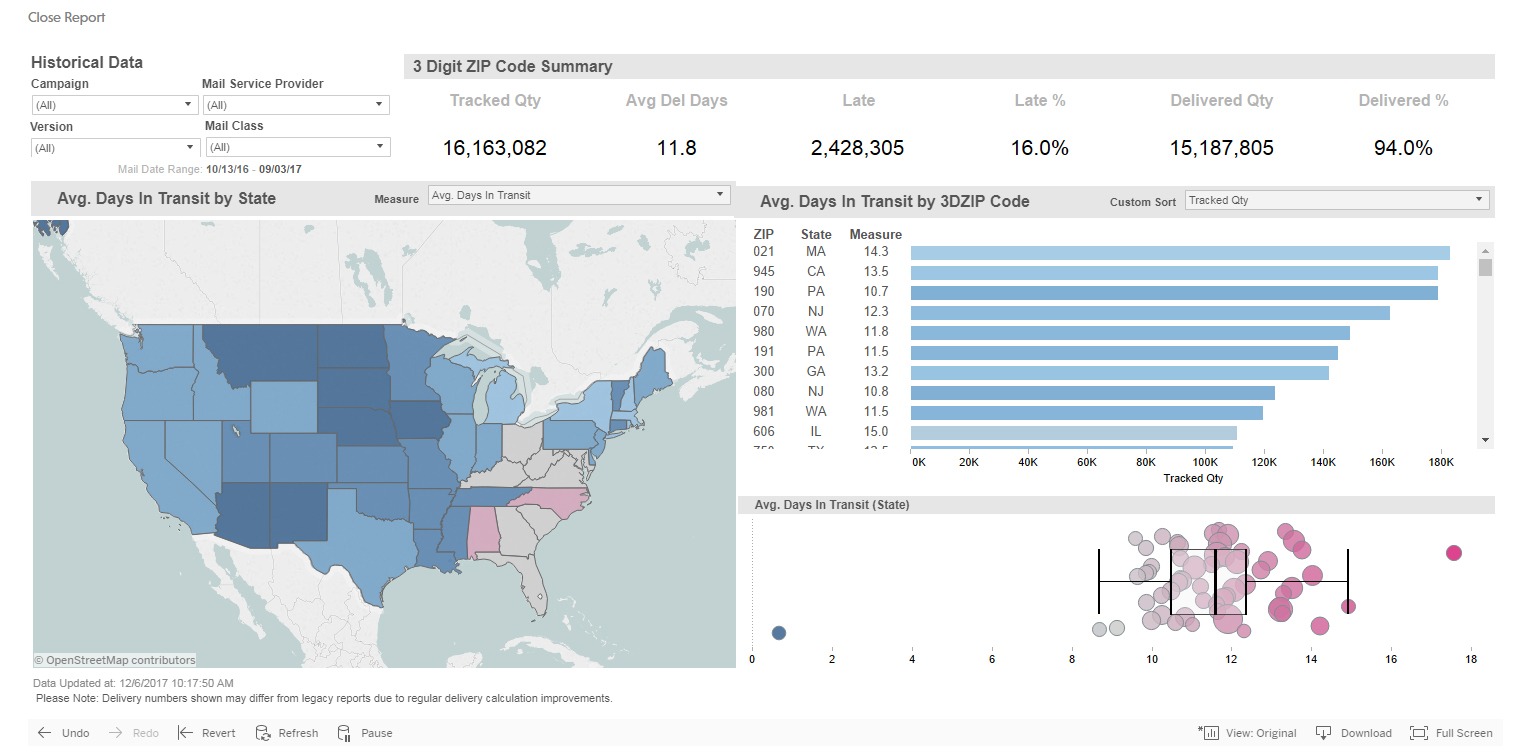
Delivery Analysis
Access information not easily spotted in traditional reports. Dive deeper to solve problems and identify opportunities. Make data-driven decisions.