Decoding USPS® Delivery Performance
Unveiling Metrics, Challenges, and Solutions in Mail Delivery Management
The USPS recently released its service performance for the first quarter of Fiscal Year (FY) 2024. They reported that 93.7% of mail is delivered in two days. However, many mailers wonder how this is possible due to the amount of delays they see in their own mailings. Lets explore that.

Product Quality Index
Energy Generation
What is Mail Delivery Performance?
Delivery performance is the time it takes to deliver a mailpiece or package from its acceptance through its delivery. The USPS monitors this data using an internal system that initiates tracking upon documented arrival at a designated postal facility. Tracking concludes when postal personnel scan the Intelligent Mail® barcode (IMB®) upon delivery at randomly selected points.
A key piece to understanding how the USPS calculates their delivery performance is understanding what mail qualifies, which is known as “mail in measurement.”
Mail in measurement refers to the volume of mail that the USPS includes in their performance measurements. This encompasses the highest quality, fully automatable mail, expected to exhibit the fastest delivery performance. The accuracy of USPS performance numbers is directly influenced by the volume of mail included in measurement, however there are several reasons that mail will not be included in measurement:
- No “start-the-clock” is the primary reason
- Causes of no “start-the-clock” data include both mailer and USPS errors related to failure to record the receipt of the piece
- There have been instances where evidence suggests that the USPS may not scan mail intentionally to initiate the “start-the-clock” process when they anticipate being unable to process it in a timely manner.
- Mail categorized as undeliverable-as-addressed is typically excluded from mail-in measurement
USPS Service Performance Update
First-Class Mail Overnight performance in Quarter 1 was 93.9 percent on time, which is 0.3 points lower than the same period last year. Two-Day performance was 91.3 percent on time, which is 1.7 points lower than the same period last year. Three-To-Five Day performance was 86.4 percent on time, which is 5.3 points lower than the same period last year.
| Time Period | Overnight (% on time) | Two-Day (% on time) | Three-To-Five-Day (% on time) |
|---|---|---|---|
| FY 2023 | 94.8% | 93.7% |
92.1% |
| FY 2024 Q1 | 93.9% | 91.3% | 86.4% |
| FY 2024 Annual Target | 95% | 95% | 93% |
Trends We’re Seeing in Our Clients’ Delivery Performance
First-Class Mail®
In business critical communications you must have a dependable supply chain, with proper processes, equipment, controls and disaster recovery who can execute on their SLA’s with minimal failures. This begins by collecting data directly from mailers and suppliers at the individual item level to ensure we have a true starting point for analysis. It’s important to note that incorrect mailing dates can distort this data, leading to inaccurate assessments.
- Performance Comparison:
- Overall, there was a decrease in First-Class Mail delivery times by 10-15% during peak season compared to the non-peak months of 2023.
- Despite this decrease in delivery times during Peak Season, the additional delivery time averaged about half a day. This is notably lower than increases seen in previous years (often a day or more) during peak periods.
- Overall, there was a decrease in First-Class Mail delivery times by 10-15% during peak season compared to the non-peak months of 2023.
- Industry Norms:
- While stable delivery year-round is preferred, the industry typically experiences slower delivery times during peak periods, reflecting an established trend.
- Yearly Trends
- Over time we’ve noticed First-Class Mail Delivery Performance is getting slower during non-peak periods:
- 2022 performance decreased from 2021
- 2023 performance was the same as 2022
- 2024 performance seems to be decreasing compared to 2023 as well, but it is still very early to make that conclusion.
- Over time we’ve noticed First-Class Mail Delivery Performance is getting slower during non-peak periods:
Marketing Mail®
For marketing mail, logistics is the most important supplier that needs to be properly managed. When being asked to by customers to help them diagnose delivery abnormalities, 9 times out of 10 there is a challenge with getting the mail to its entry location. There are many reasons this can occur such as volume, mechanical issues and poor planning, but for the most part if mail gets to its destination location on time then the mail will get in-home based on its plan.
- Delivery Impact:
- Notable instances were observed during peak mailing season with an overall increase of 5-15% in delivery time as compared to other years.
- The observed increase translates to an additional delivery time of 1-1.5 days during peak season.
- Notable instances were observed during peak mailing season with an overall increase of 5-15% in delivery time as compared to other years.
- Supplier Challenges:
- There were some mailers who were impacted more than others due to specific supplier challenges. This emphasizes the importance of supplier management and operational efficiency.
- Yearly Trends
- Over time we’ve noticed Marketing Mail Delivery Performance is getting faster during non-peak periods:
- 2022 performance increased from 2021
- 2023 performance increased from 2022
- 2024 performance also seems to be increasing compared to 2023, but it is still very early to make that conclusion.
- Over time we’ve noticed Marketing Mail Delivery Performance is getting faster during non-peak periods:
Why You Should Track Your Mail Performance
As the Nation’s largest mail tracking provider (20 billion+ mailpieces annually), aside from the USPS, we know that gaining visibility into your own mail performance is imperative, rather than relying on just USPS Statistics. Having this data at your fingertips will allow you to proactively work with internal teams, the USPS and your customers when delivery issues arise.
The Problem with Poor Delivery Performance
Several factors contribute to poor delivery performance:
Mailing location
Volume of mail (i.e. peak season)
Address accuracy
USPS staffing shortages
Severe weather
Service standards
Mailers face several challenges due to slow delivery performance, including:
Increased costs
Negative customer experience
Compliance issues (i.e. regulatory penalties)
Operational challenges
Lower marketing response rates
Monitor Delivery Performance with GrayHair’s Client Portal
At GrayHair, we’re dedicated to enhancing customer visibility by harnessing data from clients, suppliers, and the USPS. Our evolving tools and infrastructure leverage cutting-edge technology to empower data-driven decision-making. We prioritize understanding customer pain points and goals during onboarding, ensuring proper data stewardship and impactful outcomes. Transparency is key to effective operations and supplier management, driving positive ROI for our clients. More data means greater transparency, improving processes and outcomes in mailing operations.
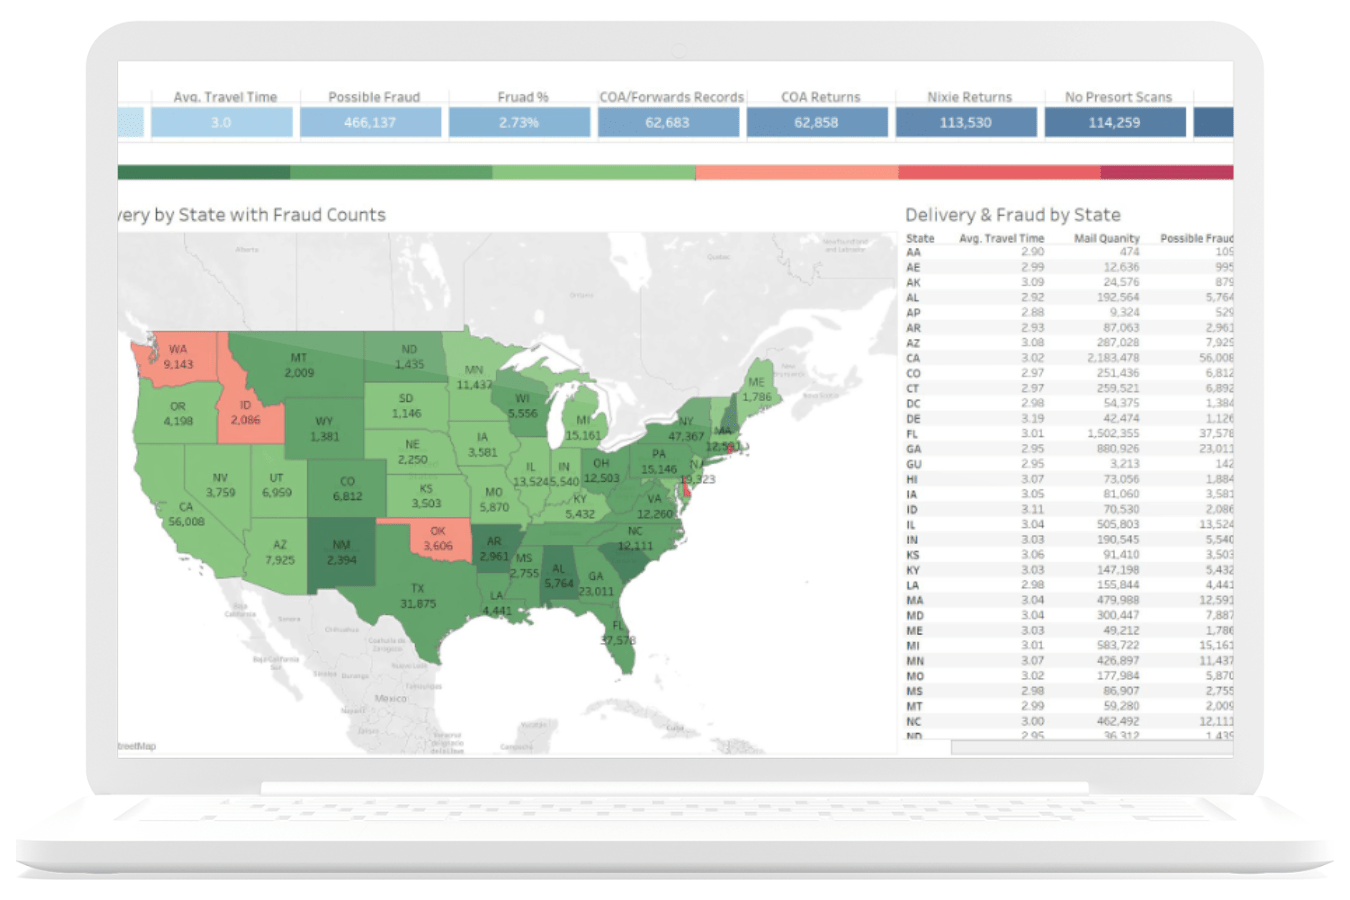
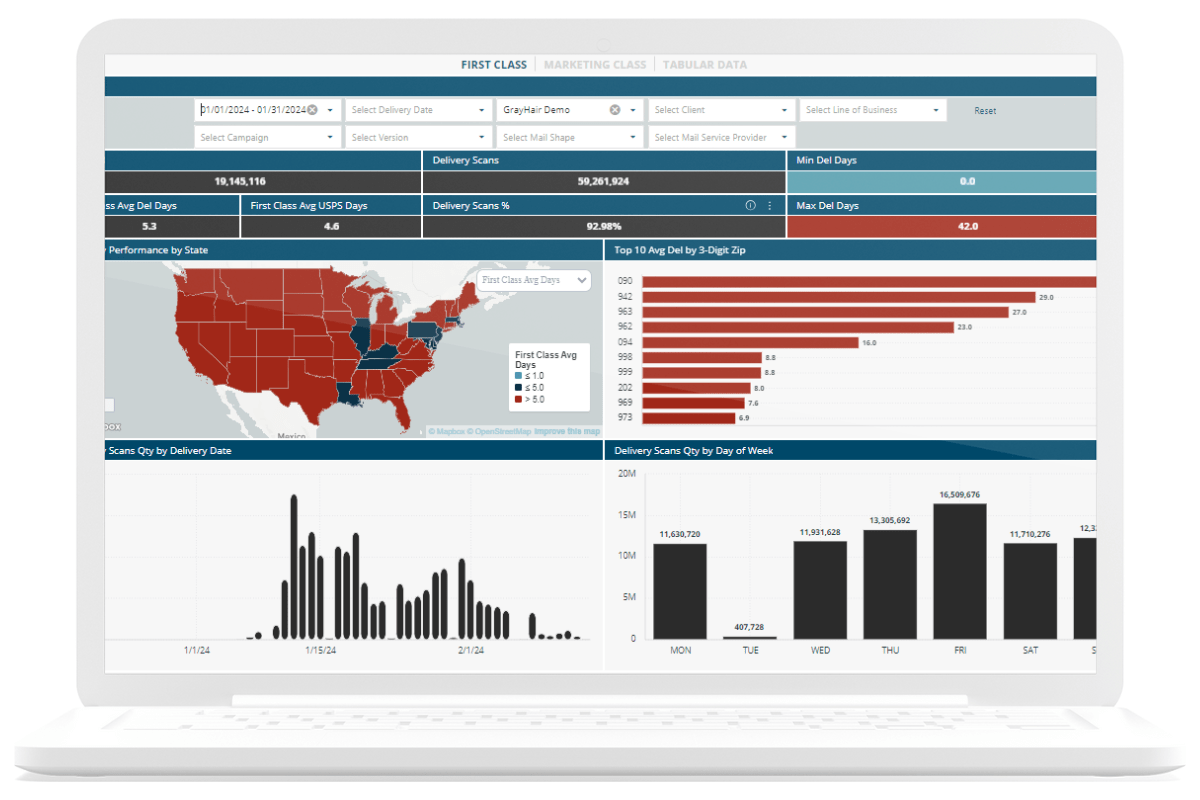
We recently launched the GrayHair Client Portal to better support mailers in effectively managing their operations and suppliers. From this portal, you can view your mail data and gain useful insights that can be accessed through easy-to-read dashboards and customizable data feeds, making it simple to proactively monitor trends, SLAs and solve problems.
GrayHair Dashboard Before

GrayHair’s New Client Portal


The Experts Take
“In my nearly 25 years in the postal industry, I’ve learned that mailing success stems from caring about a goal and implementing effective processes and controls, rather than relying solely on what you are given.
Delivery Challenges have persisted for mailers long before my time in the industry. The USPS has delivery standards that are difficult to achieve with the volume of mail and the distance it must travel. Do they have logistics issues? Yes. Are their measurement statistics somewhat ambiguous and may not actually represent what others in the industry get? Absolutely! But overall, the USPS is generally a consistent supplier. Where I have seen delivery challenges that plague mailers more so than the USPS publishes or communicates, is the management of the upstream suppliers that have work to do before the USPS even gets the mail. Some in the industry attribute poor performance to the USPS directly and frequently publish blog posts criticizing their operations. While I fundamentally disagree with the USPS’s recent price increases and do not think they are generating the revenue that they claim they need, that is a different story altogether. Wholeheartedly I do not believe the USPS needs to take the blame for what can be controlled. While specific areas or facilities may experience occasional challenges, and certain seasons may result in delays in certain areas, overall, the USPS demonstrates consistency in its operations. The recent changes to the network to streamline operations are going to cause hiccups in processing and inconsistent results at times.
Effectively managing your processes, controls and suppliers to reduce delivery issues and inconsistencies is a more difficult task. First, you need to ensure that you are measuring and improving your delivery performance. Mail tracking is obviously key to that. But also, getting as much data as possible is even more key to ensuring your measurements are correct so that bottlenecks and anomalies can be identified, and processes can be improved and measured to fix those inaccuracies. When looking at actual delivery we must ensure that we are comparing apples to apples and that we can eliminate any black boxes within our own supply chain.“
– Josh McCaully
Managing Director of Data, GrayHair Software
