GrayHair’s weekly chart on the impact of COVID on USPS Mail Volumes.
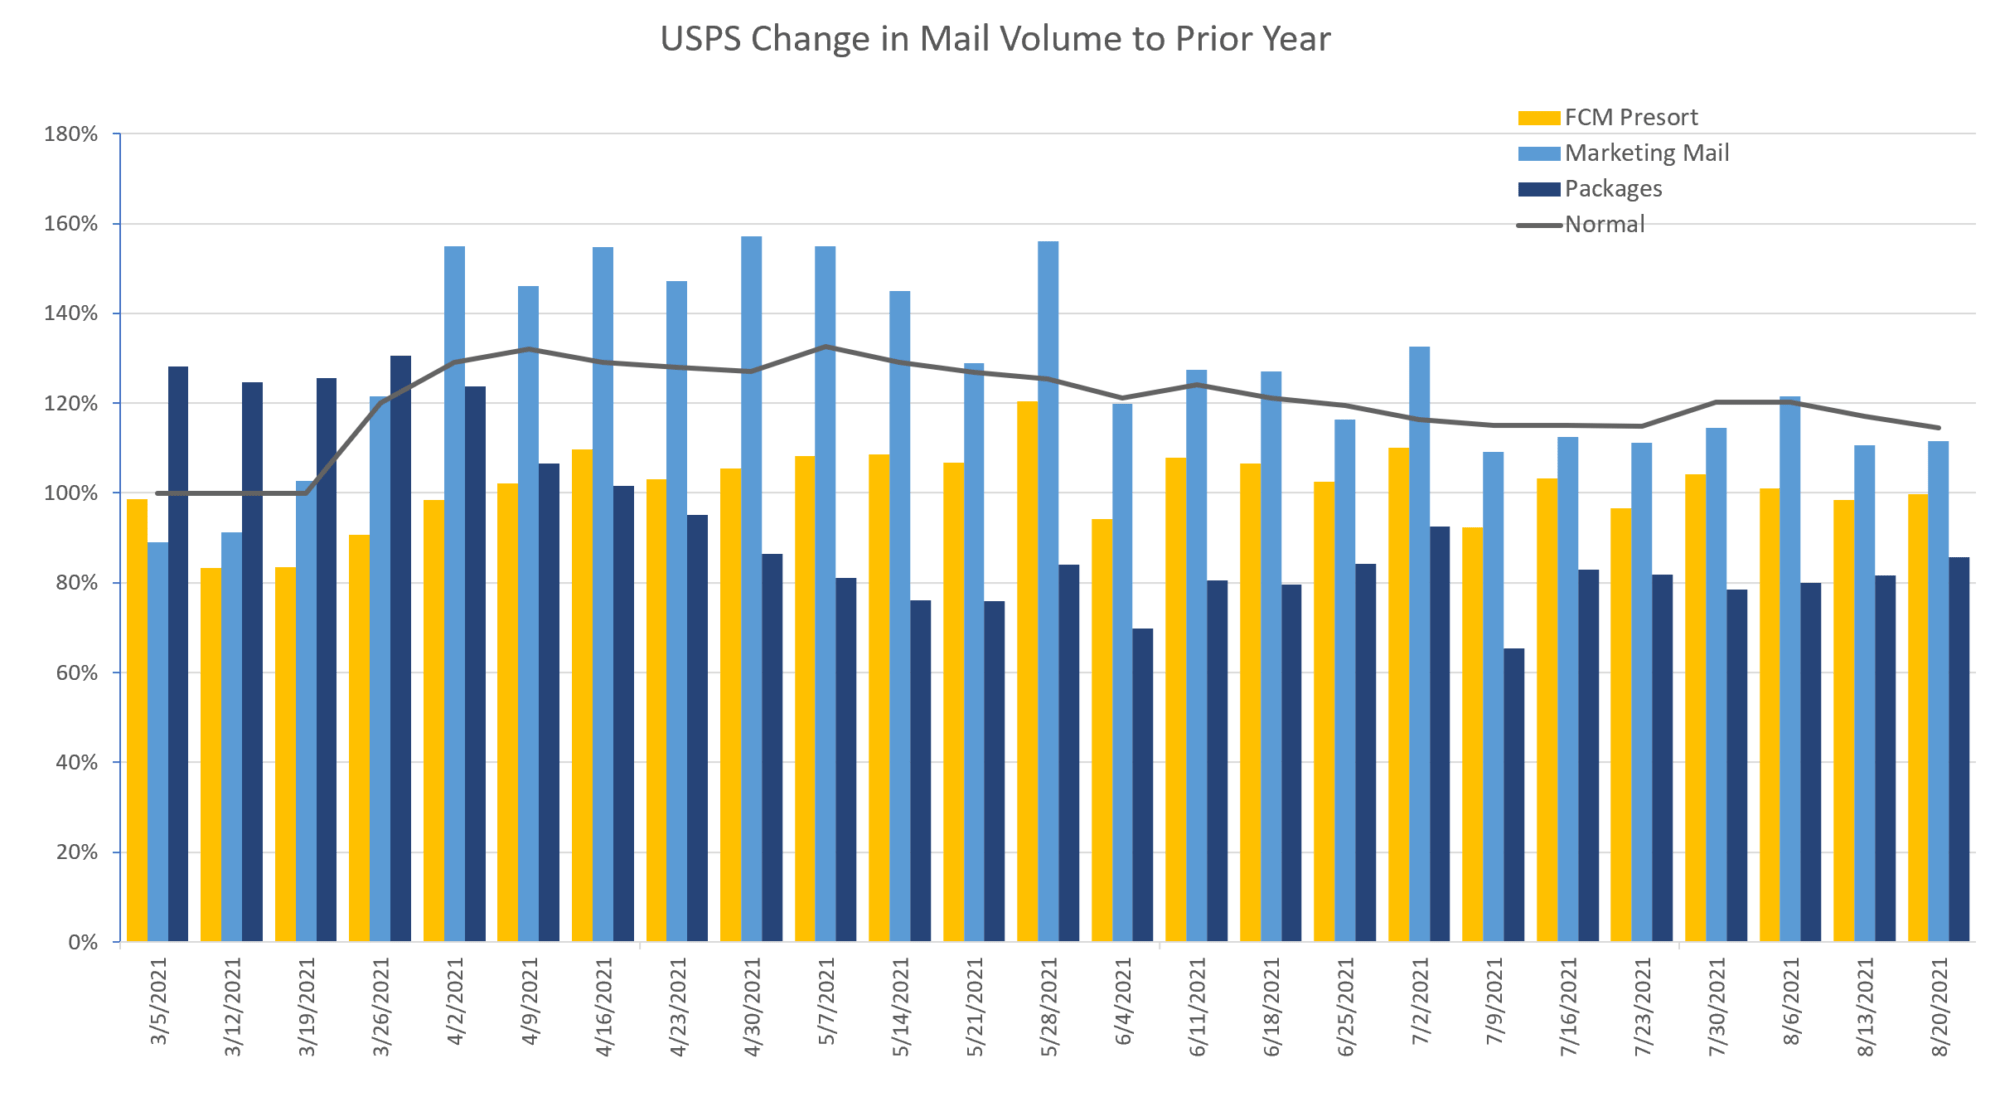
How this chart works: The black line shows the total mail volume comparison to 2019 (for all three types). The percentage along the left-hand axis shows the percentage to the prior year’s volume with 100% being the same as the prior year.
For the week ending on August 20, 2021, you can see that marketing mail is holding steady. Packages are holding steady after a sharp drop in April and early May. First-Class continues its decline at its normal pace, for now. With the price change that went into effect on the 29th, many mailers were pushing to get their campaigns into mailstream. This will result in some fluctuations in volume in the short term.
You will be able to get access to the weekly reports by following us on our big 3 social platforms: – Facebook, LinkedIn and Twitter.